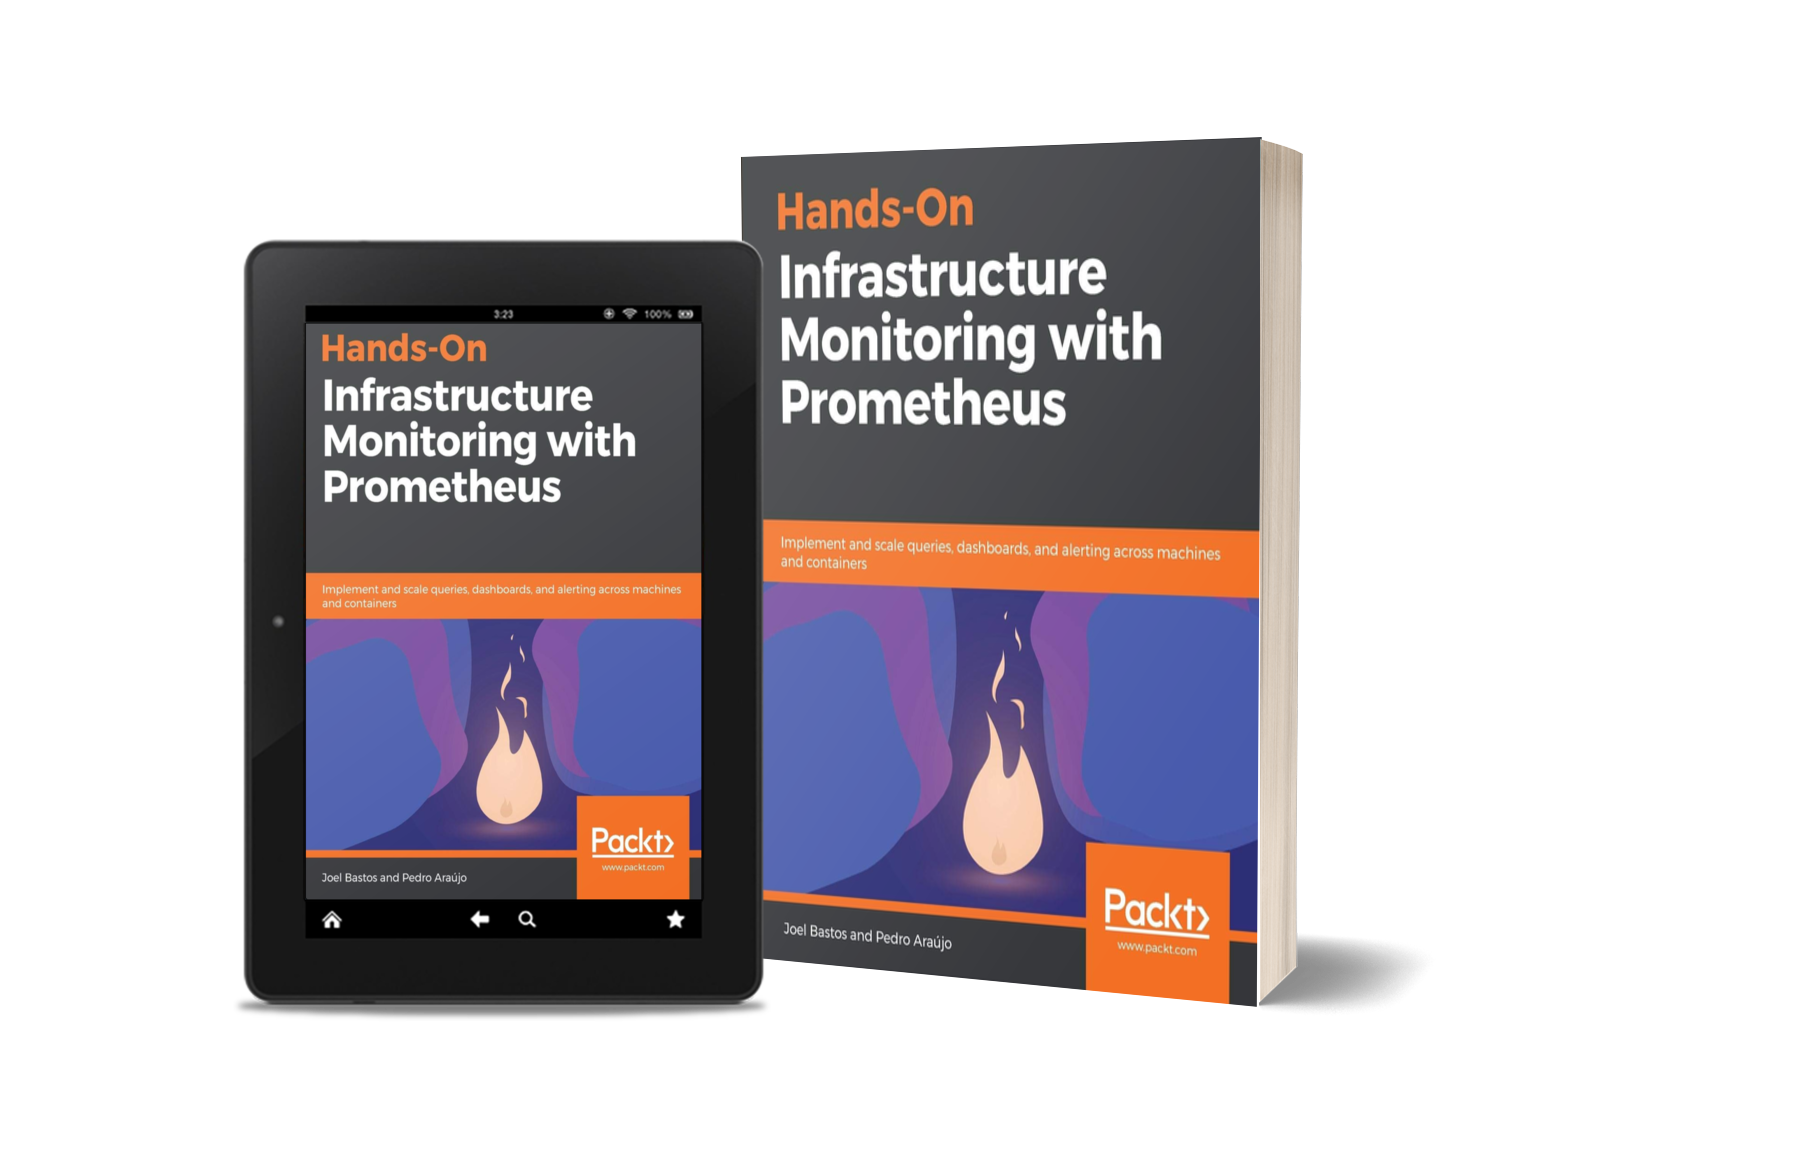
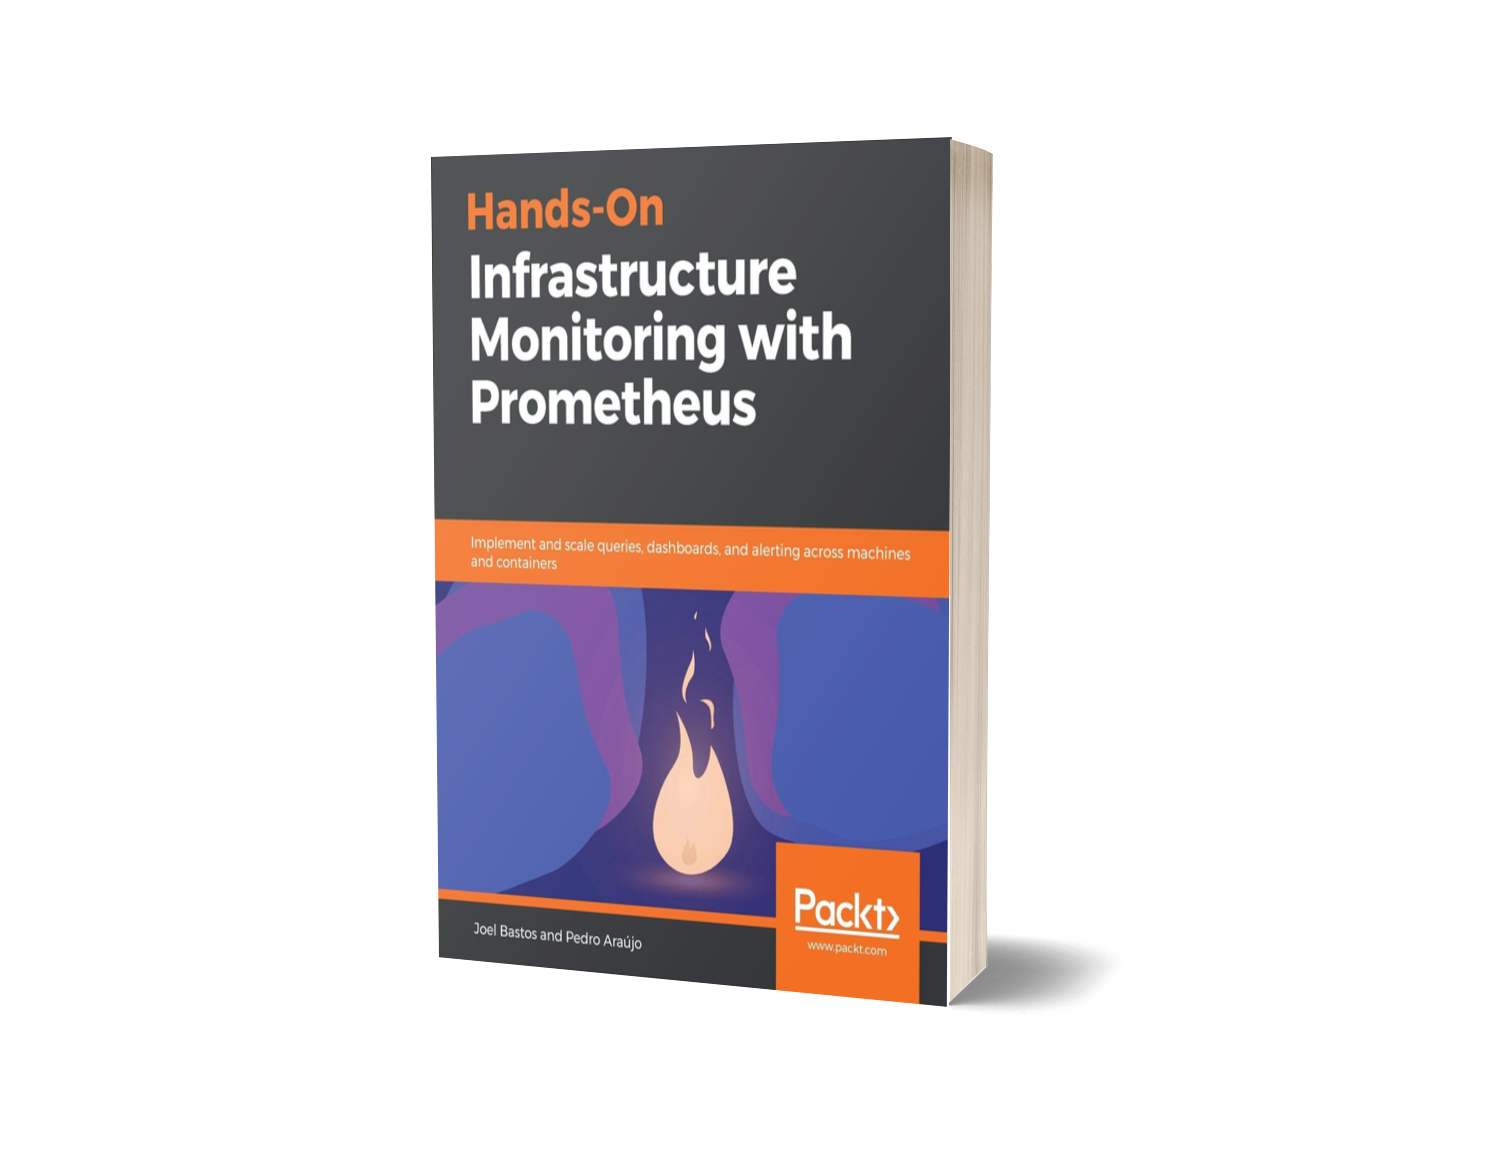
Implement and scale queries, dashboards, and alerting across machines and containers
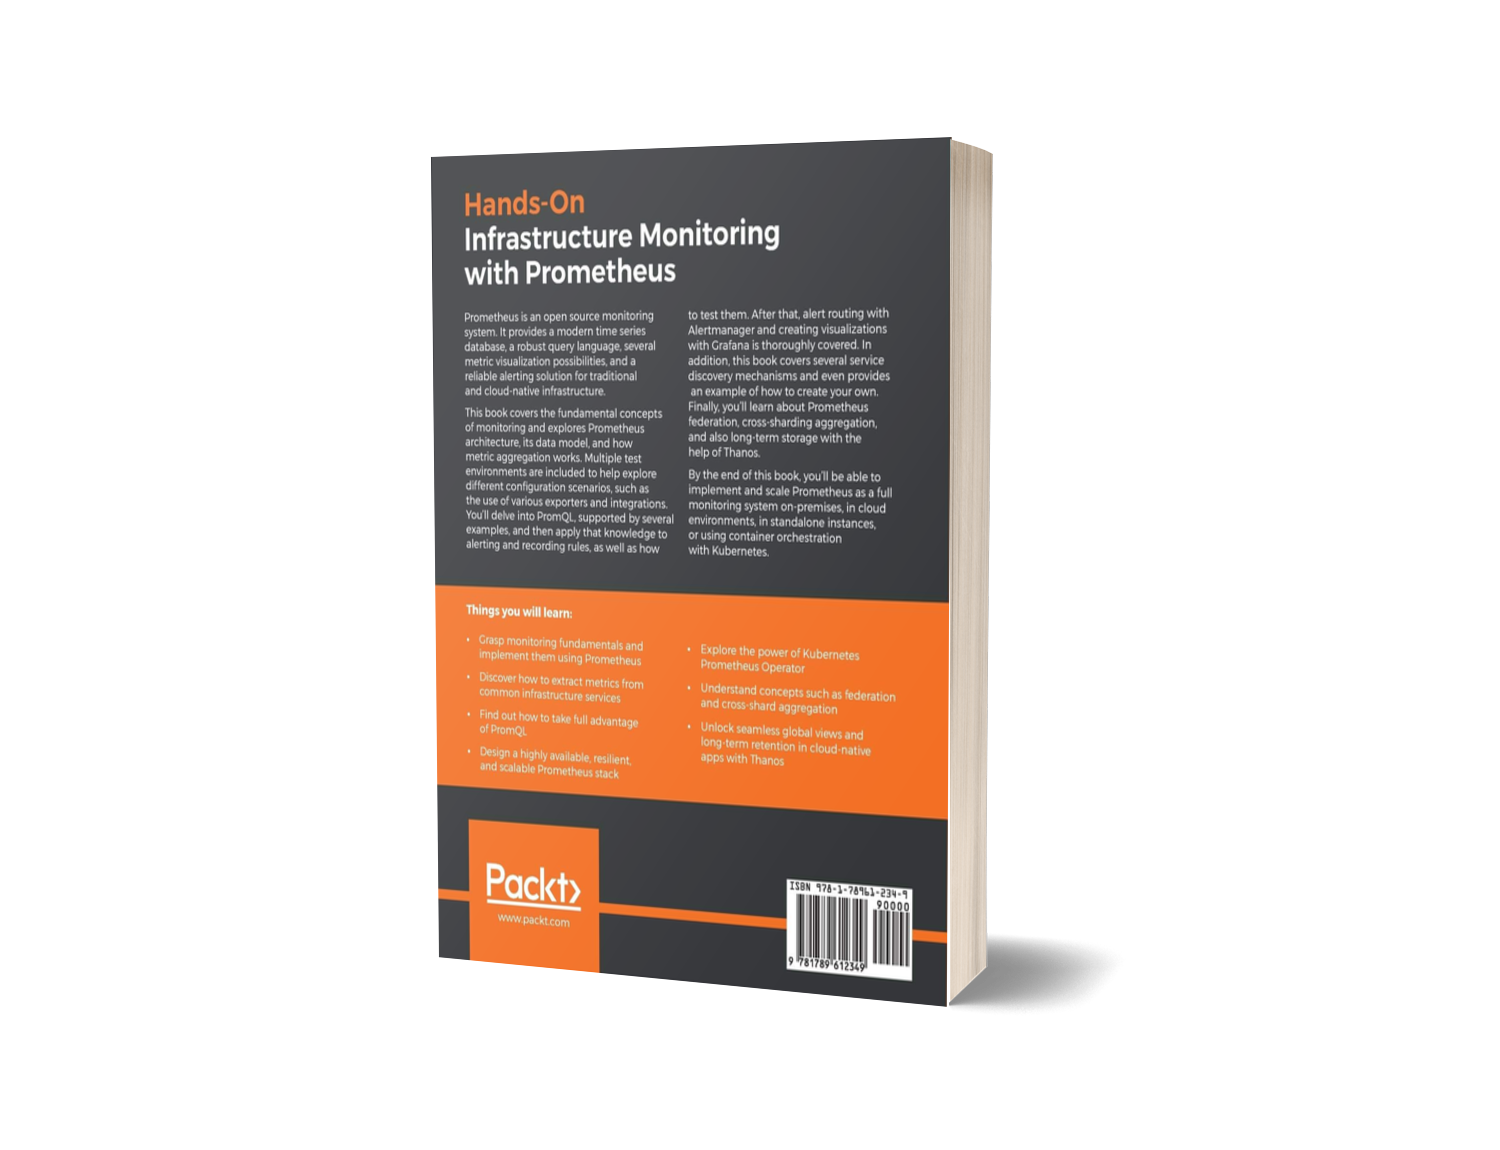
Prometheus is an open source monitoring system. It provides a modern time series database, a robust query language, several metric visualization possibilities and a reliable alerting solution for traditional and cloud-native infrastructure.
This book covers the fundamental concepts around monitoring and explores Prometheus architecture, its data model, and how metric aggregation works. Multiple test environments are included to help explore different configuration scenarios, like the use of various exporters and integrations. You’ll delve into PromQL, supported by several examples, and then apply that knowledge to alerting and recording rules, as well as how to test them. After that, alert routing with Alertmanager and creating visualizations with Grafana is thoroughly covered. In addition, this book covers several service discovery mechanisms and even provides an example of how to create your own. Finally, you’ll learn about Prometheus federation, cross-sharding aggregation and also long-term storage with the help of Thanos.
By the end of this book, you’ll be able to implement and scale Prometheus as a full monitoring system on-premises, in cloud environments, in standalone instances or using container orchestration with Kubernetes.
What you will learn
Monitoring fundamentals
Grasp monitoring fundamentals and implement them using Prometheus
Exporters and integrations
Discover how to extract metrics from common infrastructure services
Prometheus query language
Find out how to take full advantage of PromQL
Visualizations and alerting
Truly understand Alertmanager and how to create reliable alerts
Learn, build and share Grafana dashboards
Container-based monitoring with Prometheus
Explore the power of Kubernetes Prometheus Operator
Thanos and scaling Prometheus
Design a highly available, resilient, and scalable Prometheus stack
Understand concepts such as federation and cross-shard aggregation
Unlock seamless global views and long-term retention in cloud-native apps with Thanos
Technologies
Covered in the book
Supporting Technologies
Buy the book
About the Authors

Joel Bastos
Senior Infrastructure Architect
Joel Bastos is an open source supporter and contributor, with a background in infrastructure security and automation. He is always striving for the standardization of processes, code maintainability, and code reusability. He has defined, led, and implemented critical highly-available and fault-tolerant enterprise and web-scale infrastructures in several organizations, with Prometheus as the cornerstone. He has worked at two unicorn companies in Portugal and at one of the largest transaction-oriented gaming companies in the world. Previously, he has supported several governmental entities with projects such as the Public Key Infrastructure for the Portuguese citizen card.

Pedro Araújo
Principal Infrastructure Engineer
Pedro Araújo is a site reliability and automation engineer and has defined and implemented several standards for monitoring at scale. His contributions have been fundamental in connecting development teams to infrastructure. He is highly knowledgeable about infrastructure, but his passion is in the automation and management of large-scale, highly-transactional systems. Pedro has contributed to several open source projects, such as Riemann, OpenTSDB, Sensu, Prometheus, and Thanos.


